Monitor your progress and performance
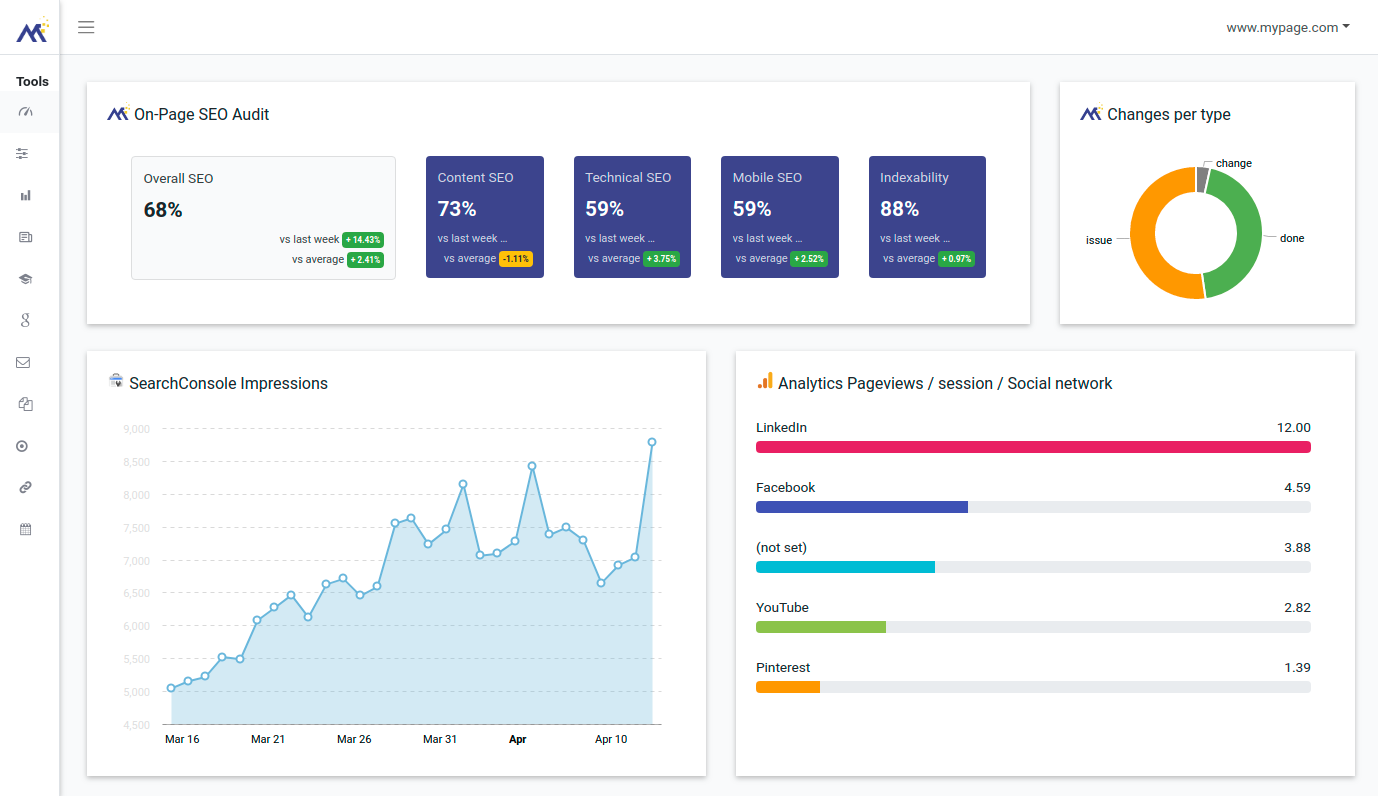
fDisplay the most important data directly with stunning graphs and give your customers real-time insight into the important KPIs of their website every day.
150+ metrics
Show and filter data based on more than 150 metrics
Discover trends
Instantly recognize trends with clear charts and overview widgets
Templates
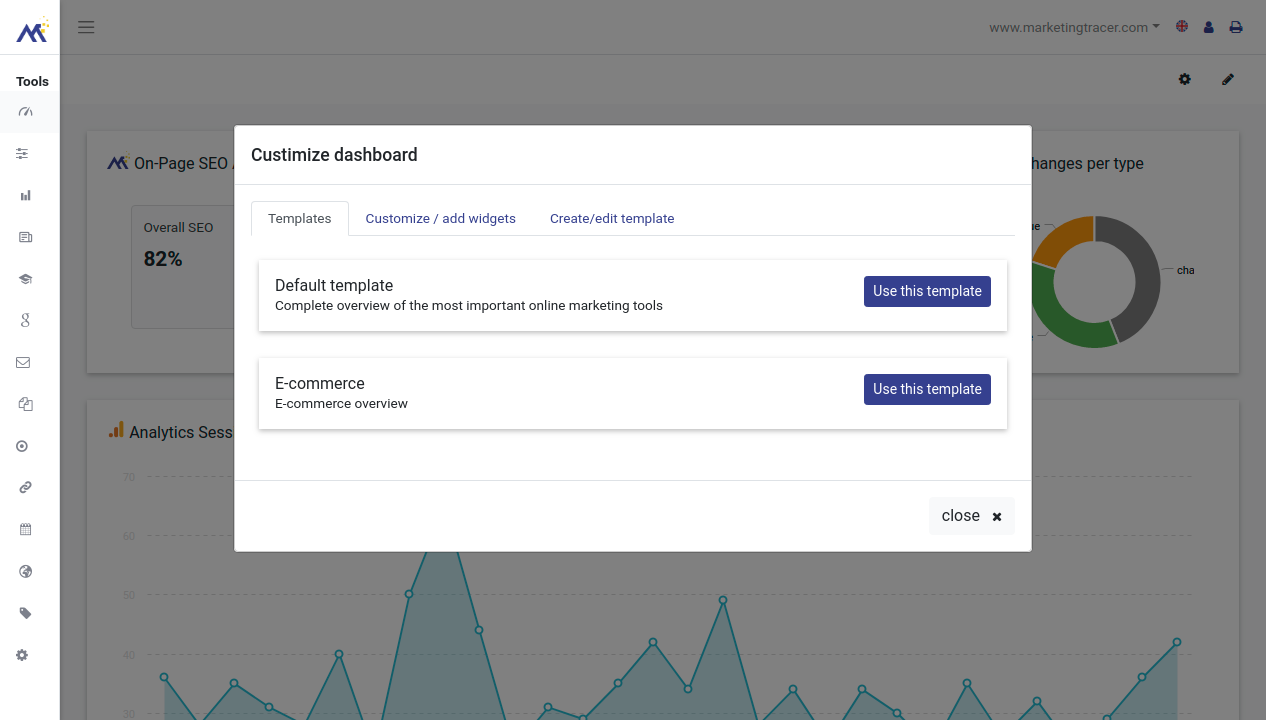
Immediately the right dashboard based on your own templates
Determine the direction
Focus each team member in the same direction with clear metrics
KPI Dashboard core feature: Instantly share important insights
You want to keep a sharp eye on your KPIs. You help the KPI Dashboard with that! You can see exactly what is going on on the site, what has changed and what the impact of this is.
The MarketingTracer KPI dashboard ensures a common focus on shared goals. Immediately after logging in you get direct access to the KPI dashboard. There you will find the most important KPI's for the organization.
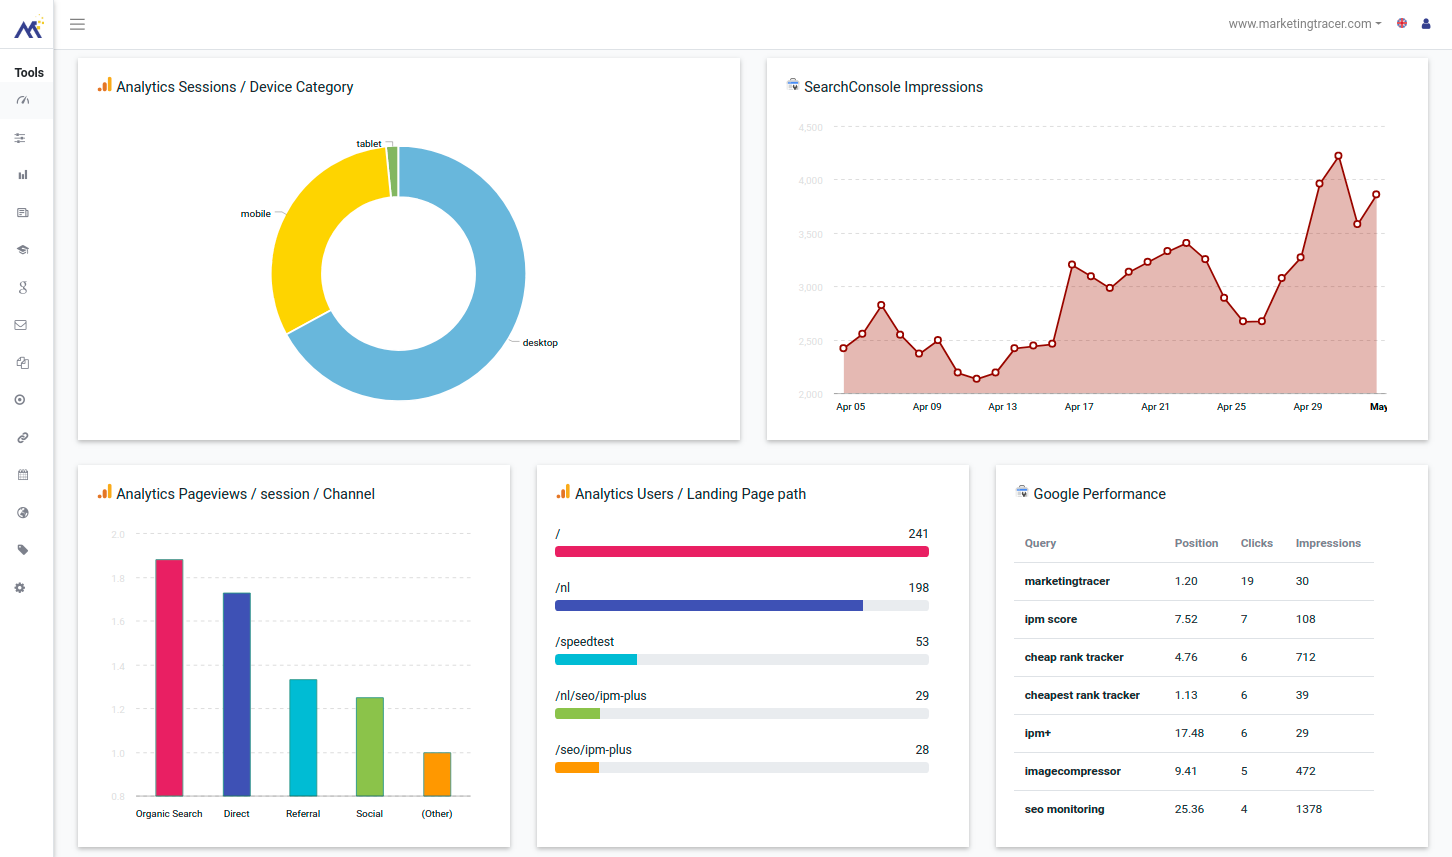
The dashboard makes your data transparent at a single glance because an image says more then rows of raw data . Immediately see whether the performance metrics have improved or decreased without an in-depth analysis of the data.
This makes it very easy to collaborate on common goals. The dashboard leaves nothing to guess. You can immediately see whether the turnover or traffic has increased or decreased.
KPI Dashboard core feature: Fully customizable
Data must be correct and available in real time. You also want to be able to check changes you make now.
Every site and organization is different and has different strategic goals. As an Agency, you do not want to turn this into a uniform on-size-fits-all, but rather show that you can respond to your cleints specific interests
That is why the MarketingTracer KPI dashboard is fully adaptable to the wishes of the customer. With over 100 metrics, 80 dimensions and 4 different widget types you can add over 32,000 different widgets.
That is a lot of choice but don't worry. Setting up a custom dashboard can be done in minutes. The widget editor help you choose the metrics you want to show.
We also ensure that you only have to create your dashboard once. When you have created a custom dashboard, you can save it as a template for the next customer!
1. What is the KPI Dashboard
The KPI Dashboard is the first page of your Dashboard. Here you will find a quick overview of the KPI's that are important to you and your client. Adjust the Dasboard to the wishes of you and your customer to get a clear overview of the most important metrics of your website. You can integrate the following tools in the KPI Dashboard.
- On-page SEO Audit
- SEO monitoring
- Rank Tracker
- Google Search console performance
- Google analytics
- Google advertising performance
- Facebook advertisement performance
- Facebook page performance
- Link building progress
2. How to add widgets to the dashboard
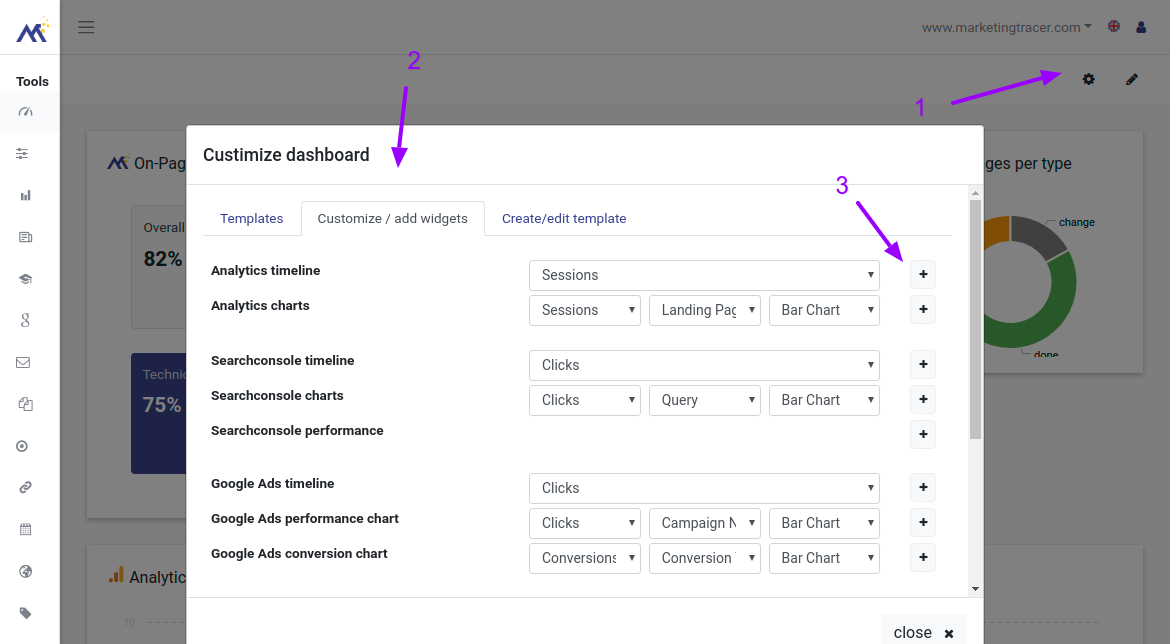
Kje kunt eenvoudig widgets toevoegen aan het KPI dashboard door op het gear icoontje te klikken rechts bovenaan. Er opent dan een dialoog waar je eenvoudig kunt kiezen uit de verschilledne widgets. Klik vervolgens op Add widgets en voeg jouw widget toe.
3. Move widgets and adjust size
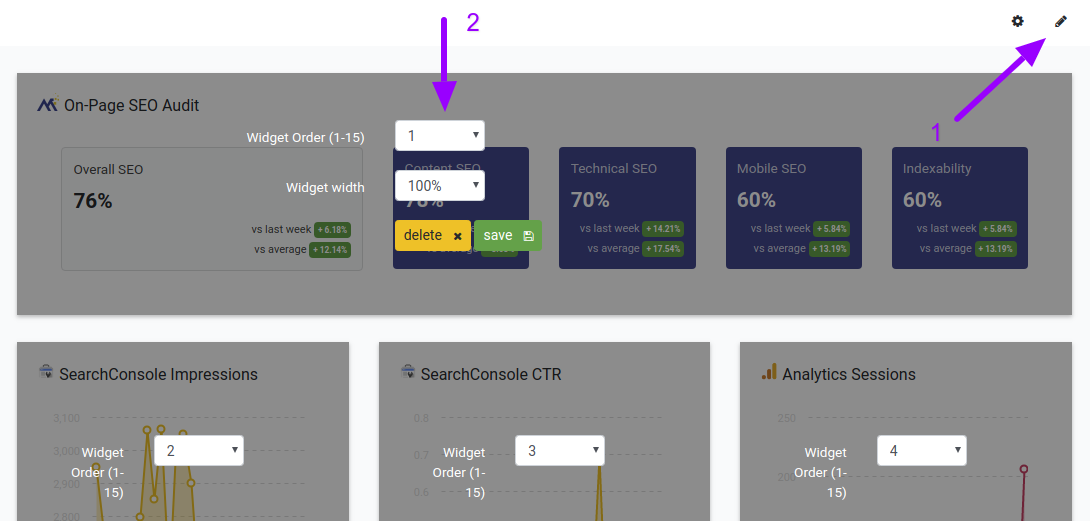
Of course you want the right widgets for your client or for your own website in the right order. You do this by entering widget via the icon. You may then adjust the order and size of the widgets.
4. Add and remove widgets
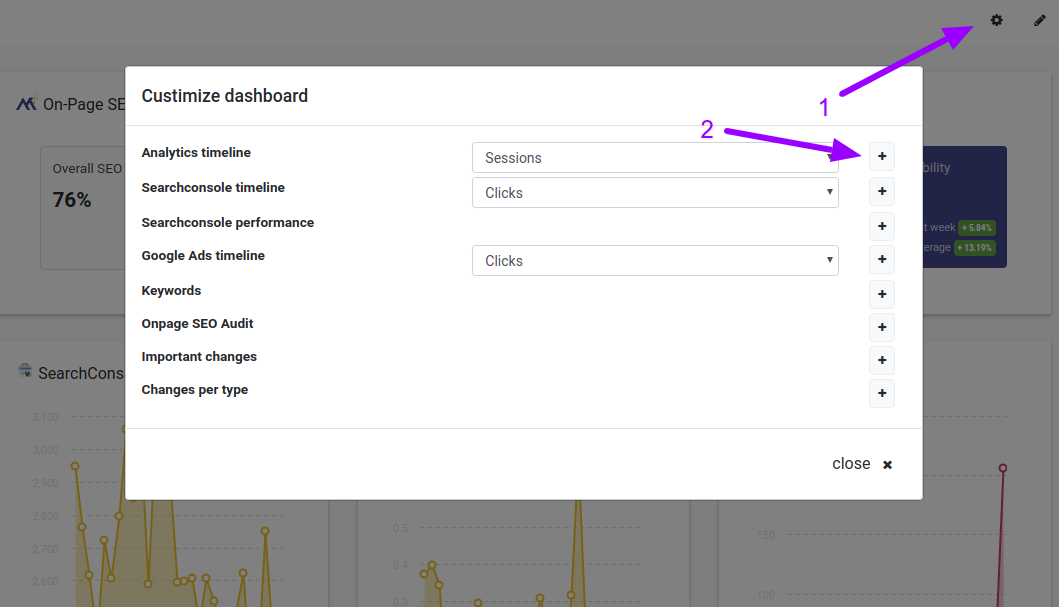
You can completely personalize your Marketing dashboard with your own widgets based on the KPIs that are important to you
Click on the gear icon and immediately add the widgets that are important to you
5. Conect widget data sources
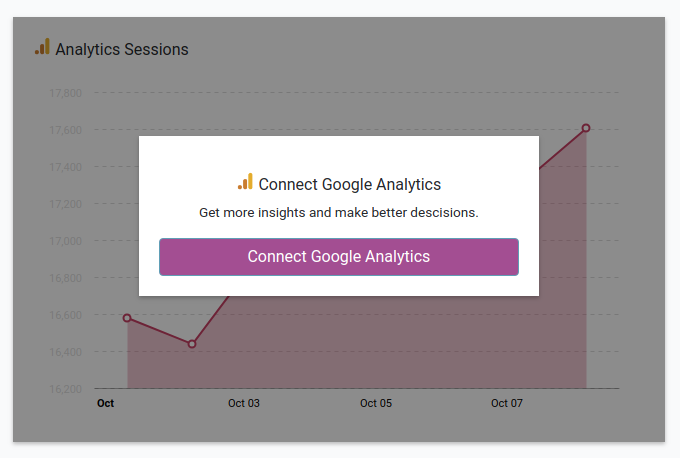
As soon as the dashboard is loaded for the first time you will notice that that some widgets require authentication. Connect your Search Console, Analytics or Facebook account to the Dashboard and allow access to the data. Link a data source by clicking on 'connect with ....'. Follow the instructions provided on the screen and connect the data source. From that moment Dashboard widgets will provide you all the information you require
